How Do You Size a UVC LED Water Sterilizer by Flow Rate and UVT?
Short answer: To size a UVC LED water sterilizer by flow rate and UVT, set the UV dose your water must receive at peak flow, correct that dose for UVT at the LED wavelength plus fouling and end-of-life output, then choose the smallest validated reactor that still clears the target dose at that flow.
Executive Summary
To size a UVC LED water sterilizer by flow rate and UVT, start with the required delivered dose, not with electrical wattage alone. Then choose a reactor that still meets that dose at the peak design flow after you correct for UV transmittance at the LED wavelength, fouling, and end-of-life output. In practice, flow rate sets residence time, UVT sets usable irradiance, and the right unit is the smallest reactor that still clears the target dose inside its validated operating envelope. Because this guide does not assume a specific target pathogen, log-reduction target, or design temperature, it uses a 40 mJ/cm² clear-water benchmark for the worked examples and flags each assumption. EPA guidance, DWI guidance, the NSF/ANSI 55 summary, and Agua Topone’s public AGLED and EC product data all support that approach.
Introduction: The Five Sizing Questions
You size a UVC LED water sterilizer by answering five questions in order. First, what peak flow must the system treat? Second, what delivered dose must it achieve for the target organism and log reduction? Third, what UVT in water treatment (opens in a new tab) does the water have at the reactor location and, ideally, at the LED emission band rather than only at 254 nm? Fourth, what derating do you need for fouling, maintenance interval, and end-of-life output? Finally, which reactor has published or validated performance that covers those conditions? EPA and DWI both frame UV design around validated operating conditions, while Agua Topone’s product pages already separate flow class, optical power, lifetime, and test evidence in the same way a buyer should structure a sizing decision.
For a practical B2B screen, size to peak flow, not average daily flow — this is exactly how flow rate affects a UVC LED water sterilizer (opens in a new tab). In the same reactor geometry, delivered dose rises when you lower flow because residence time increases; EPA states that, under ideal hydraulics, delivered dose equals average UV intensity times residence time. That simple relationship is why a 12 GPM module can produce more dose at 8 GPM than at 12 GPM, all else equal.
If you want a fast shortlist from Agua Topone’s public range, the current flow tiers look like this: EC-13 (opens in a new tab) for about 2 L/min, AGLED-40002 (opens in a new tab) or EC-12 for about 4 L/min, AGLED-40006 (opens in a new tab) for about 23 L/min, and AGLED-40012 (opens in a new tab) for about 45 L/min. However, do not jump from shortlist to final selection without dose logic. A low-UVT feed can force you to cap flow, improve pretreatment, or move up one reactor size even when the nominal flow label looks adequate.
If you are buying for an OEM or private-label project, the fastest next step is simple: send peak flow, UVT254 or UVT280, turbidity, pretreatment stack, and target reduction, then request sizing support. Agua Topone publicly supports OEM and ODM projects with model selection, technical documents, and integration guidance.
Background on UV Dose and UVT
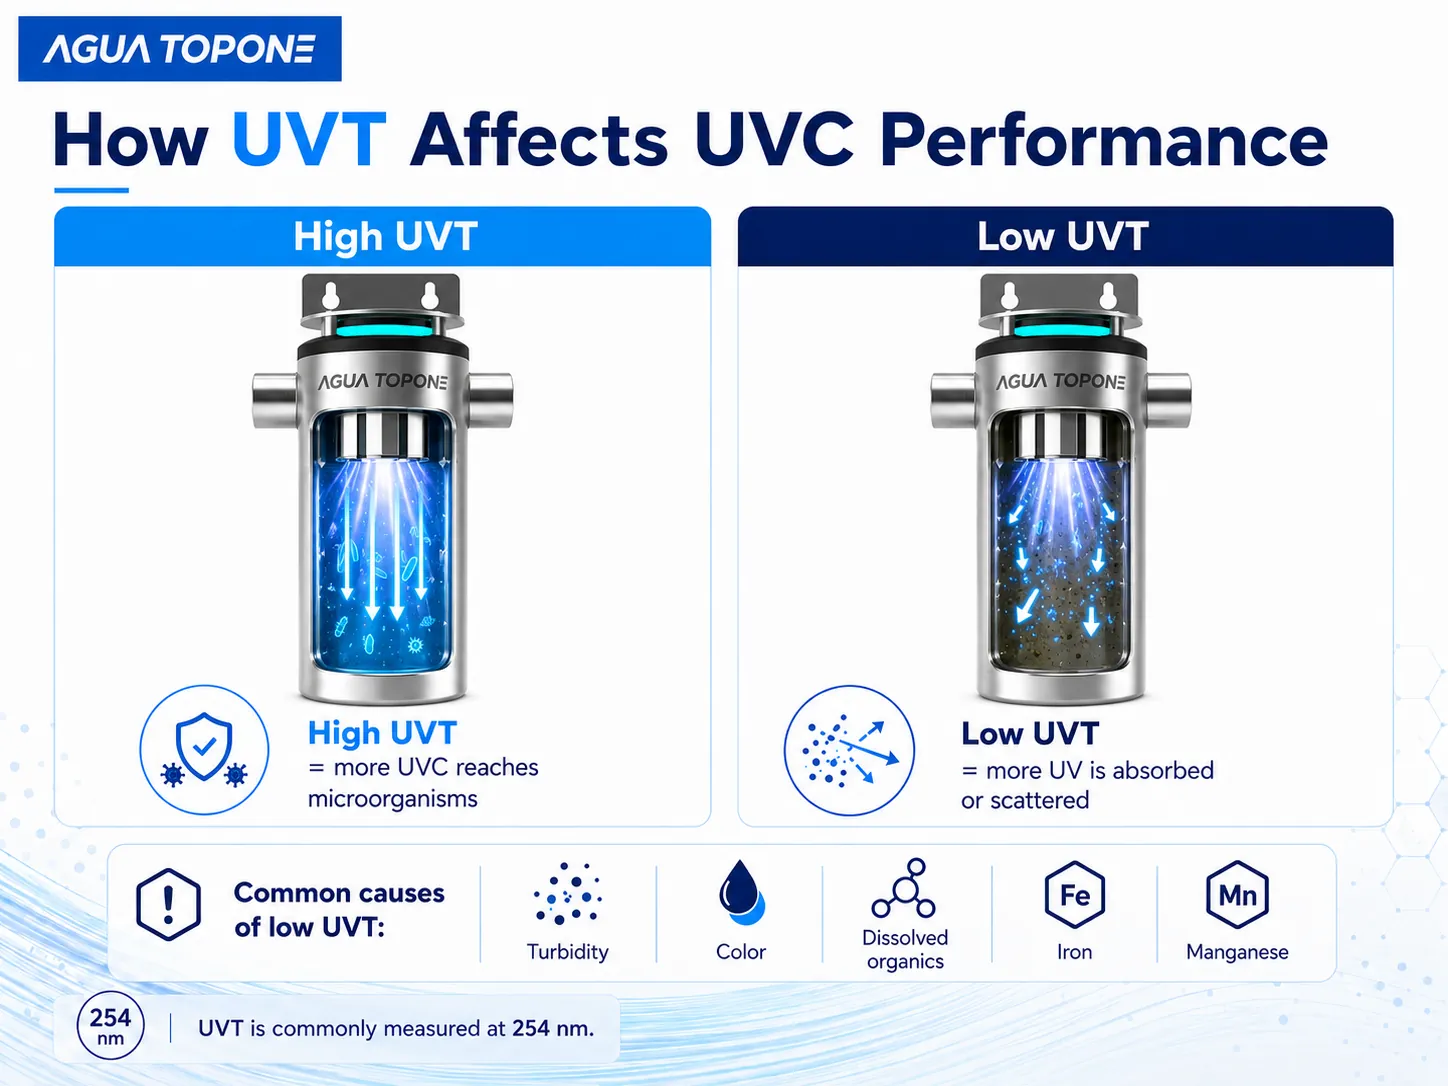
UVT tells you how much germicidal light can pass through water over a stated path length. EPA defines UVT as the fraction of incident light transmitted through the sample and gives Beer’s law in two forms: UVT = 100 × I/I₀ and UVT = 100 × 10−A, where A is absorbance at a stated wavelength and path length. The industry usually reports UVT at 254 nm and assumes a 1 cm path length unless stated otherwise.
Dose and UVT interact, but they do different jobs. Dose measures what microorganisms receive. UVT measures how hard the water matrix fights the light before it reaches those microorganisms. Therefore, a sizing model must include both. In an ideal reactor, delivered dose equals the product of average UV intensity and residence time — so higher flow reduces dose unless you recover the loss with higher irradiance, better UVT, a more efficient reactor, or longer exposure length.
Wavelength matters as much as UVT. NIST reports that, above 240 nm, the bacteria and viruses tested showed peak relative UV sensitivity between 260 and 270 nm. At the same time, wastewater often transmits 280 nm light better than 254 nm light: a 2023 Scientific Reports study found that 280 nm LEDs matched or exceeded 254 nm low-pressure lamps in community wastewater, tying that result to wavelength-dependent interactions with UV-absorbing contaminants. Therefore, if your reactor emits at 270–280 nm, a single UVT254 number may not capture real reactor attenuation well enough for final engineering.
EPA’s UV Toolkit still uses UVT254 as the baseline design parameter for conventional UV systems, yet it also recommends measuring UV transmittance across the 200–300 nm germicidal range when wavelength-dependent behavior matters. That same logic applies even more directly to UVC LEDs that emit away from 254 nm — an engineering inference from EPA’s wavelength-scan guidance plus the published 270–280 nm Agua Topone product data.
The table below shows an illustrative UVT penalty factor for a 1 cm average optical path using EPA’s Beer’s law relation. These are screening numbers, not validated reactor doses.
| UVT at the LED wavelength | Average transmittance factor (FUVT) over 1 cm |
|---|---|
| 97% | 0.985 |
| 95% | 0.975 |
| 90% | 0.949 |
| 85% | 0.923 |
| 80% | 0.896 |
| 70% | 0.841 |
| 60% | 0.783 |
These values come from FUVT = (1 − u) / (−ln u), where u = UVT/100. The table shows why UVT changes sizing quickly: a drop from 95% to 85% does not look dramatic on paper, yet it still cuts the average transmittance factor by about 5.4% before you add any fouling or aging penalty.
Sizing Methodology, Step by Step
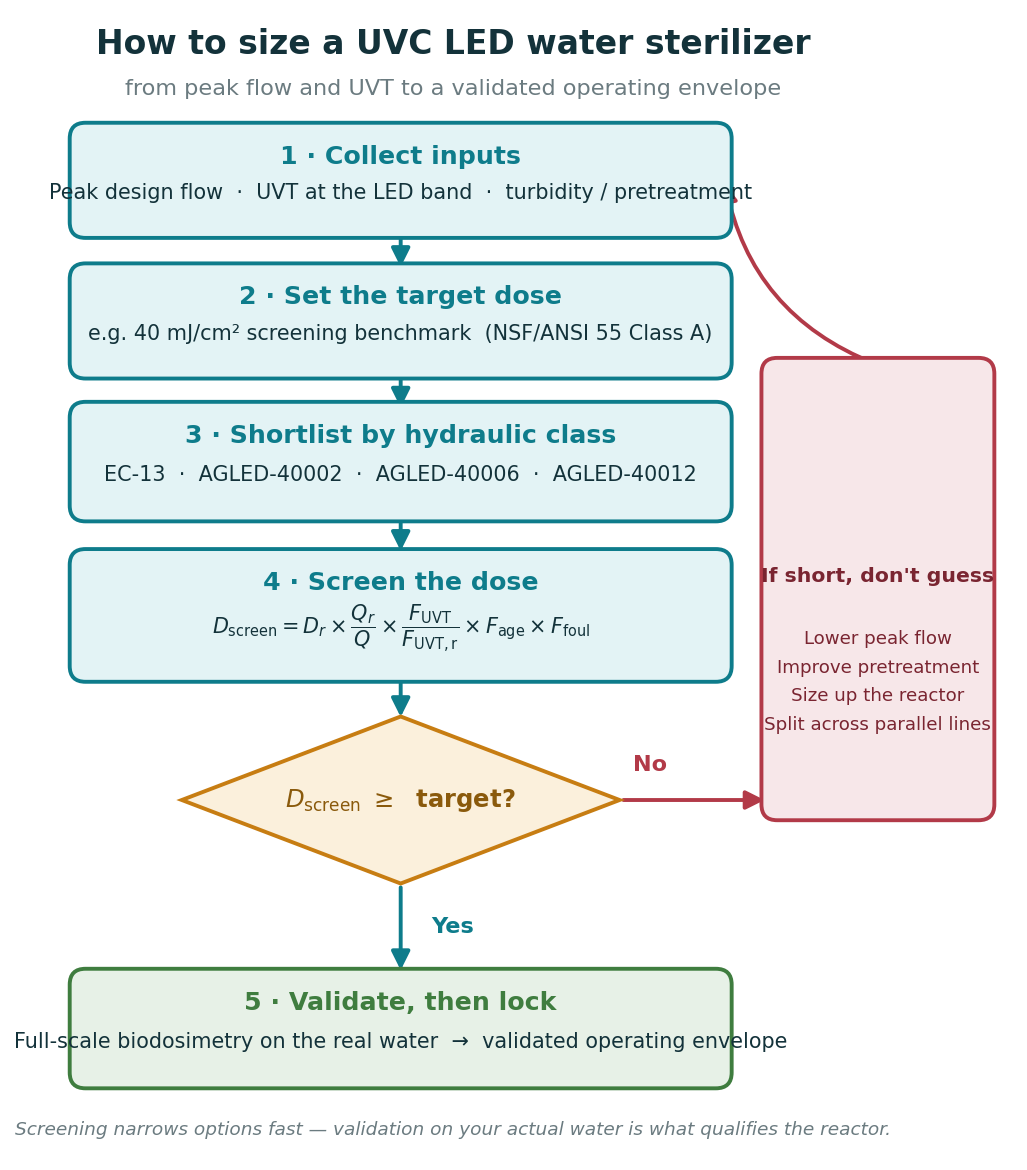
First, collect the right inputs. EPA’s UV Toolkit says design data should be collected at the point in the treatment train where the UV unit will be installed, and it suggests weekly UVT measurement when historical data are not available. DWI adds that you should treat turbidity, UV-absorbing residuals, and other water properties that can reduce UV fluence before you finalize UV design.
Second, choose the target dose. If the client or regulator already defined the organism and log-reduction target, use that number. If the application is clear drinking water and the target remains unspecified, a 40 mJ/cm² benchmark makes sense for screening because the NSF/ANSI 55 Class A summary uses that value, and Agua Topone publishes 40 mJ/cm² at 12 GPM on the AGLED-40012 page. Use that benchmark as a conservative placeholder, not as a universal rule for every organism or wavelength.
Third, shortlist the reactor family by hydraulic class and published module data. The table below compiles public Agua Topone parameters that matter most for first-pass sizing.
| Product | Typical position | Published max flow | Peak wavelength | Optical power | Rated power | Lifetime |
|---|---|---|---|---|---|---|
| EC-13 (opens in a new tab) | POU | 2.0 L/min | 270–280 nm | 55 mW | ≤2 W | L70 ≥5000 h |
| AGLED-40002 (opens in a new tab) | POU | 4 L/min | 270–280 nm | 160 mW | ≤8 W | L70 ≥5000 h |
| AGLED-40006 (opens in a new tab) | Compact POE | 23 L/min | 270–280 nm | 500 mW | 16 W | L70 5000 h |
| AGLED-40012 (opens in a new tab) | High-flow POE | 45 L/min | 270–280 nm | 2000 mW | 50 W | 5000 h |
Fourth, run a transparent screening equation on one reactor family at a time:
Dscreen = Dr × (Qr/Q) × (P/Pr) × (FUVT/FUVT,r) × Fage × Ffoul × Ftemp
| Symbol | Meaning | What to do |
|---|---|---|
| Dr | Published or validated reference dose | Use manufacturer or validation data |
| Qr | Published or validated reference flow | Use the exact reference condition |
| Q | Proposed peak design flow | Use peak expected operating flow |
| P/Pr | Optical power ratio | Use only if you change LED power within the same validated family |
| FUVT/FUVT,r | UVT ratio at the LED wavelength | Calculate from Beer’s law |
| Fage | End-of-life output factor | Use L70 or tighter if your warranty basis requires it |
| Ffoul | Fouling and maintenance factor | Set from the site maintenance plan |
| Ftemp | Temperature factor | Apply only if you have temperature derating data |
This equation works as a screening tool only when reactor geometry and hydraulics stay the same. EPA’s UV Toolkit states that every reactor model should be evaluated independently, and DWI says each reactor must be validated for the site-specific hazards and operating conditions at that works. Therefore, do not transfer a dose claim from one reactor family to a different family without fresh test data.
Fifth, act on the result. If the screened dose falls short, do not guess. Lower peak flow, add or improve pretreatment, move to a larger reactor, or split the duty across parallel lines. DWI explicitly requires pretreatment when turbidity or UV-absorbing properties can hurt disinfection, and it prohibits operation outside validated conditions unless another risk control is in place.
Example Calculations Using Real UVC LED Product Parameters
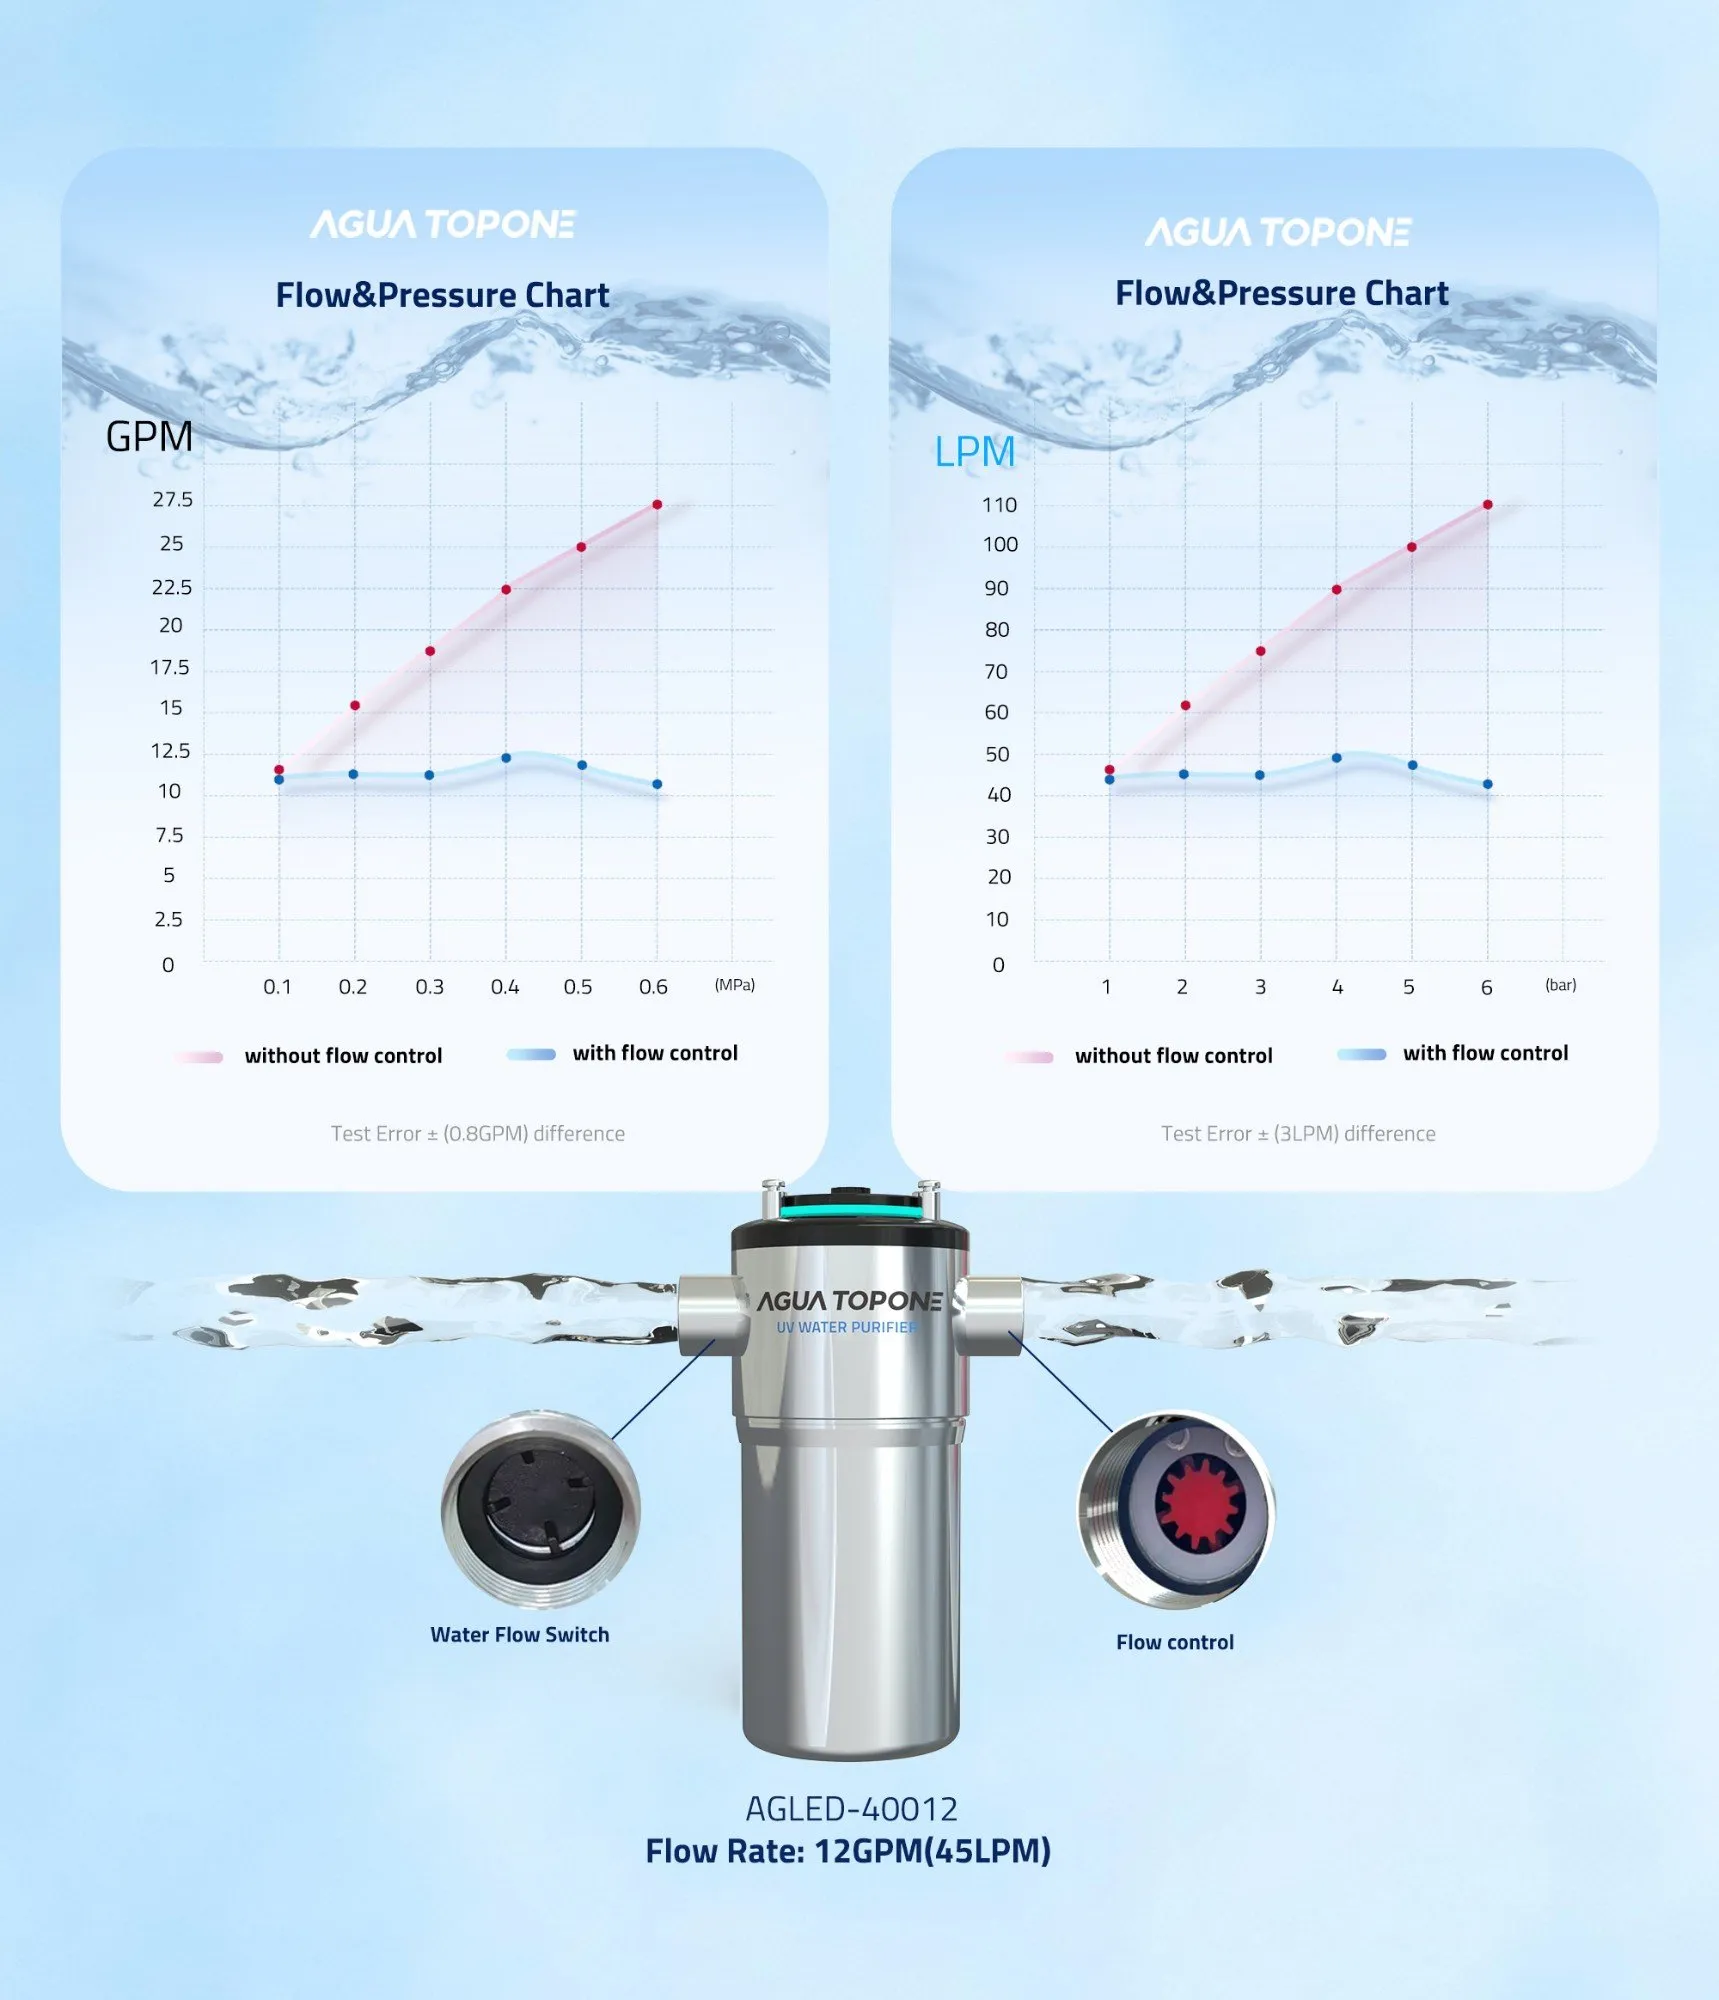
The cleanest worked example starts with the AGLED-40012 (opens in a new tab), because its public page gives a full reference point: 12 GPM, 270–280 nm, 2000 mW optical power, 50 W rated power, and 40 mJ/cm² at 12 GPM. The page also lists 1–45°C water temperature, >3 L/min startup flow, and IP67 protection.
For the examples below, the public page does not state these, so they are assumptions: the published 40 mJ/cm² rating reflects a clean reactor, the reference water sits near 95% UVT at the LED band, and the target remains 40 mJ/cm². Those assumptions let us demonstrate the math, but they do not replace factory validation.
| Example input | Value |
|---|---|
| Reference reactor | AGLED-40012 |
| Published reference dose (Dr) | 40 mJ/cm² |
| Published reference flow (Qr) | 12 GPM |
| Published optical power (Pr) | 2000 mW |
| Assumed reference UVT | 95% at 270–280 nm |
| Target dose | 40 mJ/cm² |
Scenario A: same reactor, same UVT, lower peak flow
If the client needs 8 GPM instead of 12 GPM and water quality stays at the same UVT, the screening dose becomes:
Dscreen = 40 × (12 / 8) = 60 mJ/cm²
That result means the same AGLED-40012 gains a 50% dose margin simply because flow falls from 12 to 8 GPM. If the water stays clear and other derating factors stay mild, the reactor should clear a 40 mJ/cm² target comfortably.
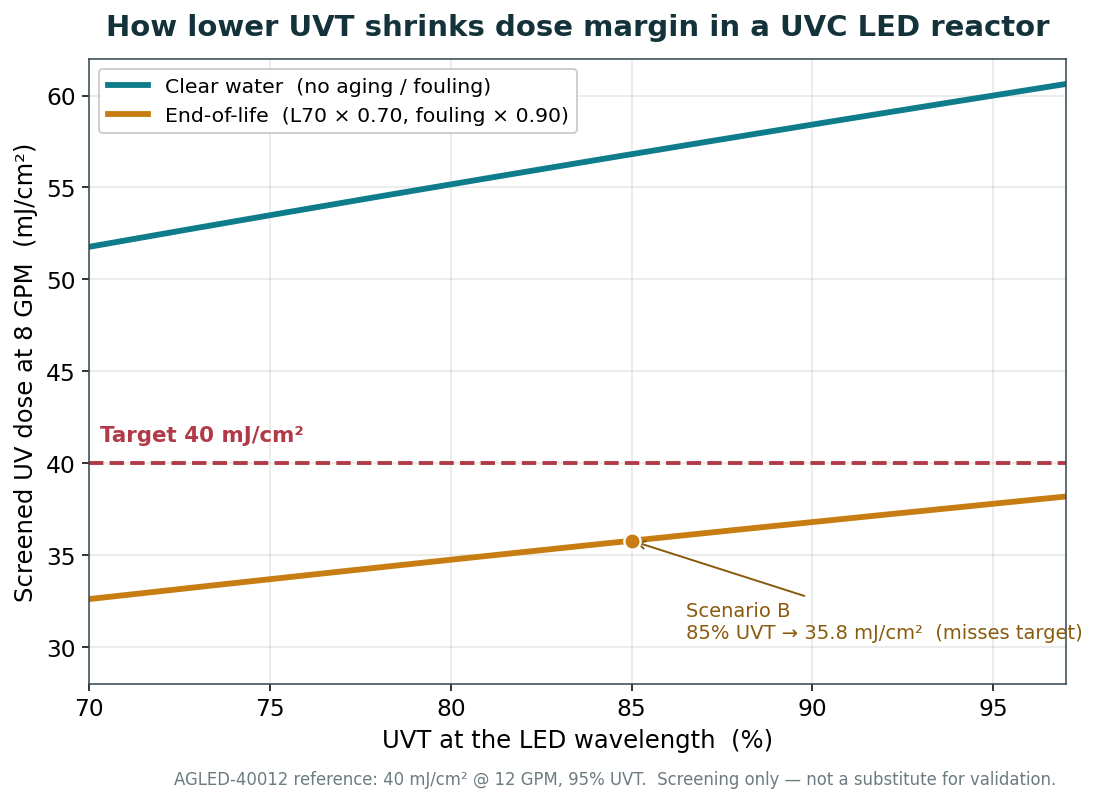
Scenario B: same reactor, same 8 GPM flow, but lower UVT plus conservative derating
Now assume UVT at the LED wavelength drops from 95% to 85%, the module reaches end of life at L70 = 0.70, and you budget 0.90 for fouling between cleanings. Using the 1 cm average transmittance factors from Beer’s law, FUVT,85/FUVT,95 ≈ 0.923/0.975 = 0.947. The screening dose becomes:
Dscreen = 40 × (12 / 8) × 0.947 × 0.70 × 0.90 ≈ 35.8 mJ/cm²
That result misses the 40 mJ/cm² target. In other words, the same module that looked oversized under clear-water conditions becomes undersized after you apply realistic UVT and maintenance penalties.
Scenario C: solve the maximum allowable flow under Scenario B
If the target must stay at 40 mJ/cm², solve for allowable flow:
Qallow = 12 × 0.947 × 0.70 × 0.90 ≈ 7.2 GPM
Therefore, a conservative engineer would either cap demand near 7.2 GPM, raise UVT through pretreatment, shorten the maintenance interval, or move to a larger or parallelized design. That answer flows directly from the AGLED-40012 reference point and EPA’s Beer-Lambert framework.
| Scenario | Flow | UVT assumption | Aging × fouling | Screened dose | Decision |
|---|---|---|---|---|---|
| A | 8.0 GPM | Same as reference | 1.00 × 1.00 | 60.0 mJ/cm² | Acceptable screen |
| B | 8.0 GPM | 95% → 85% | 0.70 × 0.90 | 35.8 mJ/cm² | Misses 40 mJ/cm² |
| C | 7.2 GPM | 95% → 85% | 0.70 × 0.90 | 40.0 mJ/cm² | Restores target |
These examples show the core sizing lesson clearly: flow labels alone do not size the reactor; flow, UVT, and derating together size the reactor. For a fast project review, request sizing support and send your peak flow, UVT data, pretreatment scheme, and target reduction so the supplier can screen the AGLED-40006, AGLED-40012, or a custom OEM layout against your actual envelope.
Testing and Validation
A screening equation helps you avoid obvious mis-sizing, but it does not prove compliance. EPA’s UV Toolkit says reactor validation is complex, reactor conditions are unique, and every reactor model should be evaluated independently using empirical data. DWI takes the same position: only validated reactors should be used for disinfection, with full-scale biodosimetry as the preferred validation method until an equivalent method proves itself.
EPA’s UVDGM describes biodosimetry in practical terms. It measures the inactivation of a challenge microorganism through the reactor and converts that inactivation into a reduction equivalent dose. That method matters because real continuous-flow hydraulics almost never behave like ideal beakers or perfect plug flow, and hydraulic effects can separate calculated dose from actual delivered dose. A full-scale 275 nm study reached the same conclusion: the UV-LED reactor tracked bench behavior well at 90% UVT275, yet hydraulic effects still influenced performance, especially at higher UVT.
Agua Topone’s public SGS reports add useful startup test logic. For the AGLED-40006, SGS reports (opens in a new tab) challenge testing with E. coli ATCC 25922, an influent of 3.3 × 10⁶ CFU/100 mL, an effluent below 1 CFU/100 mL, and a tested flow of 24 L/min. For the AGLED-40012, SGS reports the same strain, an influent of 2.0 × 10⁶ CFU/100 mL, an effluent below 1 CFU/100 mL, and a tested flow of 50 L/min. Those are strong startup challenge results, but they remain condition-specific. They do not eliminate the need to validate your own water matrix, UVT range, maintenance basis, and control logic.
For ongoing control, DWI says operators should continuously monitor and record at least flow, lamp status and UV fluence rate, turbidity, maintenance, and lamp operating time. EPA’s UV Toolkit adds that germicidal sensors for new systems should have a spectral response peaking between 250 and 280 nm — a fit for UVC LED systems, because the Agua Topone modules in this review all sit in the 270–280 nm band.
Installation Notes
Pretreatment decides whether the UV reactor gets a fair chance to work. DWI states that suppliers must pre-treat water to remove properties that hurt disinfection, requires turbidity below 1 NTU, and notes that WHO ideally wants median turbidity below 0.2 NTU for effective UV disinfection. DWI also identifies natural organic matter, iron, manganese, nitrate, and sulphite as water-quality factors that can reduce UVT and therefore lower delivered fluence.
Placement and chemical sequencing also matter. DWI recommends dosing chlorine or chloramine after the UV stage because those residuals can absorb UV and hurt UV performance if they sit upstream. EPA’s UV Toolkit says design data should be taken at the exact process location where UV will be installed. Therefore, measure UVT where the reactor will actually see the water, not at the raw-water intake and not in a different branch of the process.
The product-level limits matter just as much as the water data. Agua Topone publishes 0.8 MPa maximum inlet pressure and 1–45°C water temperature for both the AGLED-40006 and AGLED-40012, plus startup flow thresholds of >1.5 L/min for the AGLED-40006 and >3 L/min for the AGLED-40012. The recent note on AGLED-40012 pressure drop and flow control (opens in a new tab) adds practical installation guidance: use a pretreatment filter upstream, confirm inlet pressure and actual peak demand, and avoid unnecessary restrictions in the piping layout.
For B2B projects, do not send only the nominal flow rate when you ask for a quote. Send peak and normal flow, UVT254 and UVT280 if available, pretreatment type, pressure range, water source, maintenance interval, and target reduction. That package lets the supplier screen whether one module, two modules in parallel, or a custom OEM manifold makes the most sense. Agua Topone explicitly offers OEM and ODM support for that kind of integration work.
Limitations and FAQs
This guide stays rigorous by drawing a hard line between screening and validation. The public Agua Topone pages give real product parameters and real startup challenge-test data, but they do not publish the full validated UVT envelope, the dose-monitoring equation, the rating basis for the 40 mJ/cm² claim, or temperature-correction curves. EPA and DWI both make clear that final acceptance must come from reactor-specific validation inside the intended operating envelope. Use the math here to narrow options fast, then validate the selected design on the water you will actually treat.
Should I size on average flow or peak flow?
Size on peak flow, because dose drops as flow rises in the same reactor. If you size on average flow, simultaneous taps or process spikes can push the reactor outside its intended dose range.
Can I use UVT254 for a 275–280 nm LED reactor?
Use UVT254 as a baseline because the industry still standardizes around it. However, if the reactor emits at 270–280 nm, you should also measure or correlate UVT at the LED band, because wavelength-dependent attenuation can shift delivered dose materially.
What should I send when I request sizing support?
Send peak flow, target organism or log reduction, UVT254 and UVT280 if available, turbidity, pretreatment scheme, pressure range, water source, water-temperature range, and required maintenance interval. That dataset lets a supplier screen both dose margin and installation fit.