UV vs. Chlorinated Water Disinfection: Which Is Better for Drinking Water Treatment?
Direct answer
UV and chlorination do not solve the same problem in the same way. UV delivers a validated light dose, usually expressed in mJ/cm², at the point of treatment. Chlorination delivers a chemical exposure, usually expressed as CT, the product of residual disinfectant concentration and contact time, in min·mg/L. As a result, UV works as a high-performance primary disinfection barrier, while chlorine works as both a primary disinfectant and an ongoing secondary barrier because it leaves a measurable residual in water. EPA’s drinking-water guidance reflects that distinction directly.
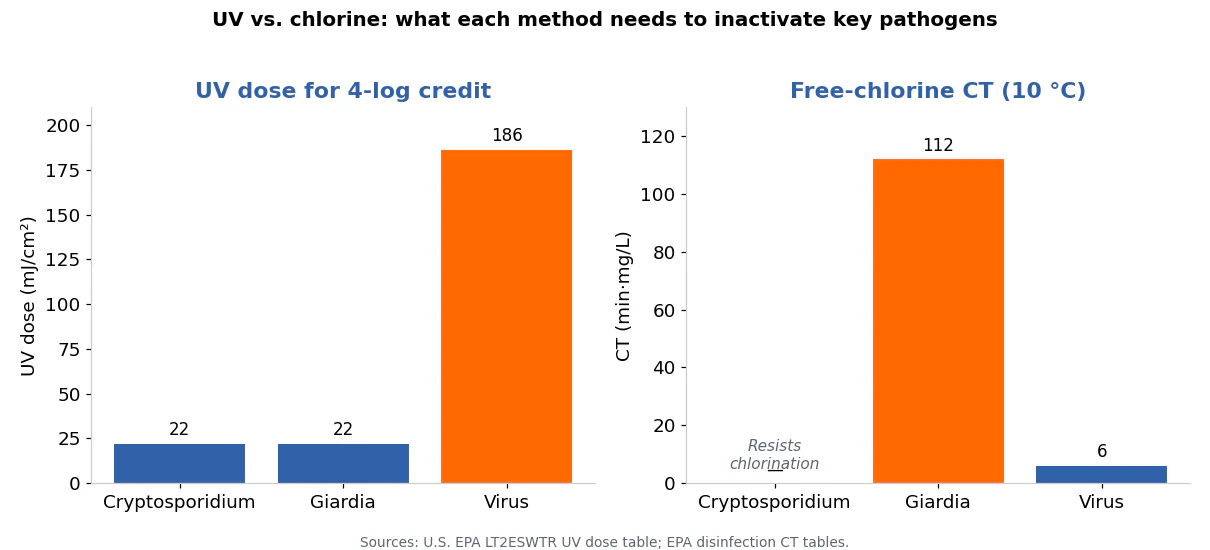
On pathogen control, the split is sharp. EPA’s LT2ESWTR UV table assigns 4-log credit at 22 mJ/cm² for both Cryptosporidium and Giardia, but 186 mJ/cm² for viruses, which shows why UV shines against chlorine-tolerant protozoa but must work harder on viruses (EPA, 2006). By contrast, free chlorine can reach 4-log virus inactivation at 6 min·mg/L at 10 °C and pH 6–9, yet 3-log Giardia inactivation at 10 °C and pH 7.0 with a 1.0 mg/L free chlorine residual needs a CT of 112 min·mg/L; EPA also notes that Cryptosporidium resists common chlorination practices (EPA, 2020; EPA, 2001).
Operationally, chlorine wins when water sits in tanks or moves through a building or municipal distribution system because WHO recommends maintaining a free chlorine residual through distribution, with ≥0.5 mg/L after at least 30 minutes at pH <8.0 and 0.2 mg/L at the point of delivery (WHO, 2022). However, chlorine also introduces tradeoffs: EPA regulates disinfection byproducts at 0.080 mg/L for TTHMs and 0.060 mg/L for HAA5, EPA caps chlorine residual at an MRDL of 4.0 mg/L as Cl₂, and WHO notes that some consumers can taste chlorine or chloramines at concentrations as low as 0.3 mg/L (EPA, 2025; WHO, 2003).
For most drinking-water applications, UV is the better primary disinfection method when you need strong control of protozoa, low taste impact, and no chlorine-based byproduct burden at the point of treatment; chlorination is the better secondary method when you need a protective residual in storage or distribution. If you ask which is “better” overall, the most accurate answer is this: use UV when you want the cleanest primary microbial barrier, use chlorine when you must maintain residual protection, and use both when the system needs both performance profiles.
Full comparison
If a buyer asks whether UV or chlorinated water disinfection is better, the right response starts with system design, not brand preference. First, identify the microbial target. Next, ask whether water will move straight to the point of use or sit in a tank or network. Finally, check whether the source water can support validated UV performance or stable chlorine chemistry. Those three questions usually decide the winner faster than any marketing claim.
How UV and chlorine actually differ
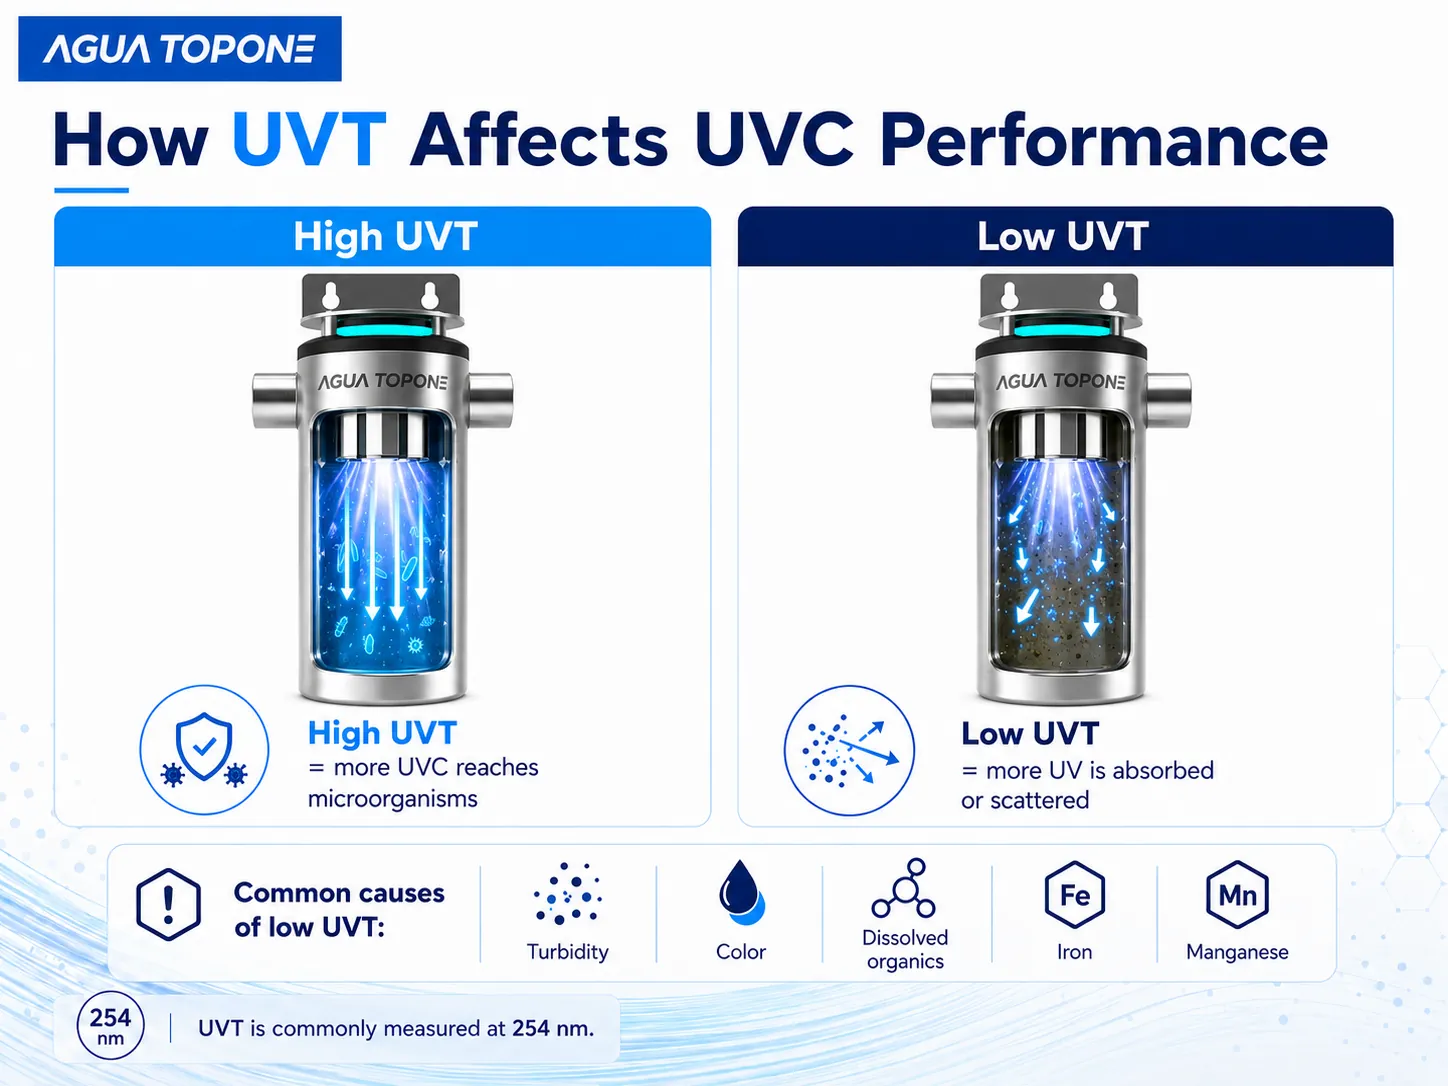
UV inactivates microorganisms by photochemical damage to their genetic material. Chlorination, by contrast, depends on free chlorine species in water, principally hypochlorous acid and hypochlorite, whose relative proportions change with pH. That difference matters because UV performance depends on delivered dose, hydraulics, fouling, and UV transmittance, while chlorine performance moves with pH, temperature, chlorine demand, and contact time. Beck and colleagues describe UV’s genome-damaging action directly, and WHO’s chlorine fact sheet shows that hypochlorous acid and hypochlorite sit in pH-dependent equilibrium, with roughly equal concentrations at pH 7.5 and 25 °C (Beck et al., 2016; WHO, 2003).
| Factor | UV disinfection | Chlorination |
|---|---|---|
| Core metric | UV dose in mJ/cm² | CT in min·mg/L |
| Residual after treatment | None | Yes |
| Strongest use case | Primary barrier, especially for protozoa and clear finished water | Primary and secondary disinfection where residual matters |
| Main performance drivers | UVT, flow, reactor hydraulics, fouling, lamp/LED output | pH, temperature, chlorine demand, contact time |
| Protozoa control | Strong against Cryptosporidium and Giardia | Weak against Cryptosporidium; Giardia requires high CT |
| Virus control | Effective, but higher dose requirements apply | Strong at relatively low CT under favorable pH/temperature |
| Sensory and byproduct impact | No chlorine taste or chlorine residual at treatment point | Residual protection, but taste/odor and regulated DBPs can become limiting |
| Best practical fit | POU, POE, clear post-filtration streams, protozoa-focused barriers | Tanks, long plumbing runs, buildings, municipal distribution |
Table basis: EPA UV dose and validation guidance, EPA CT tables, WHO chlorine guidance, and EPA DBP regulations.
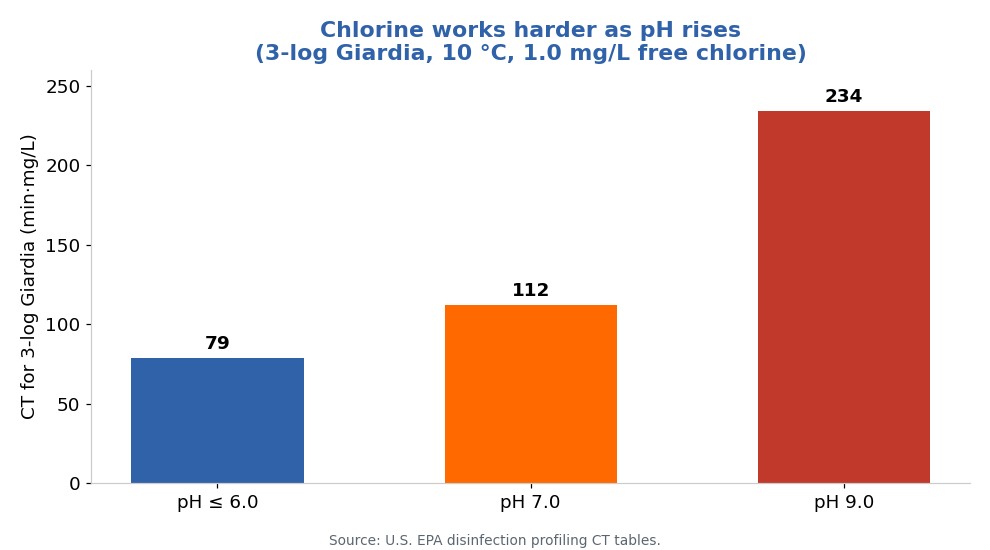
Chlorine chemistry changes enough with pH and temperature that engineers cannot treat “1 ppm chlorine” as a universal answer. WHO notes that free chlorine species shift with pH, and EPA’s CT tables show the practical consequence. For example, at 10 °C and 1.0 mg/L free chlorine, 3-log Giardia inactivation rises from 79 min·mg/L at pH ≤6.0 to 234 min·mg/L at pH 9.0. Chlorine still works, but it demands tighter chemical control than many buyers expect.
Chlorination also adds chemical management duties that UV avoids. EPA’s DBP rules target TTHMs and HAA5, which form when chlorine-based disinfectants react with natural organic and inorganic matter. EPA sets enforceable limits of 0.080 mg/L for TTHMs and 0.060 mg/L for HAA5. In addition, WHO notes that chlorate and some perchlorates can increase in hypochlorite solutions during storage at high ambient temperatures or when operators add new hypochlorite to old stock. That makes chemical storage discipline part of the disinfection design, not an afterthought.
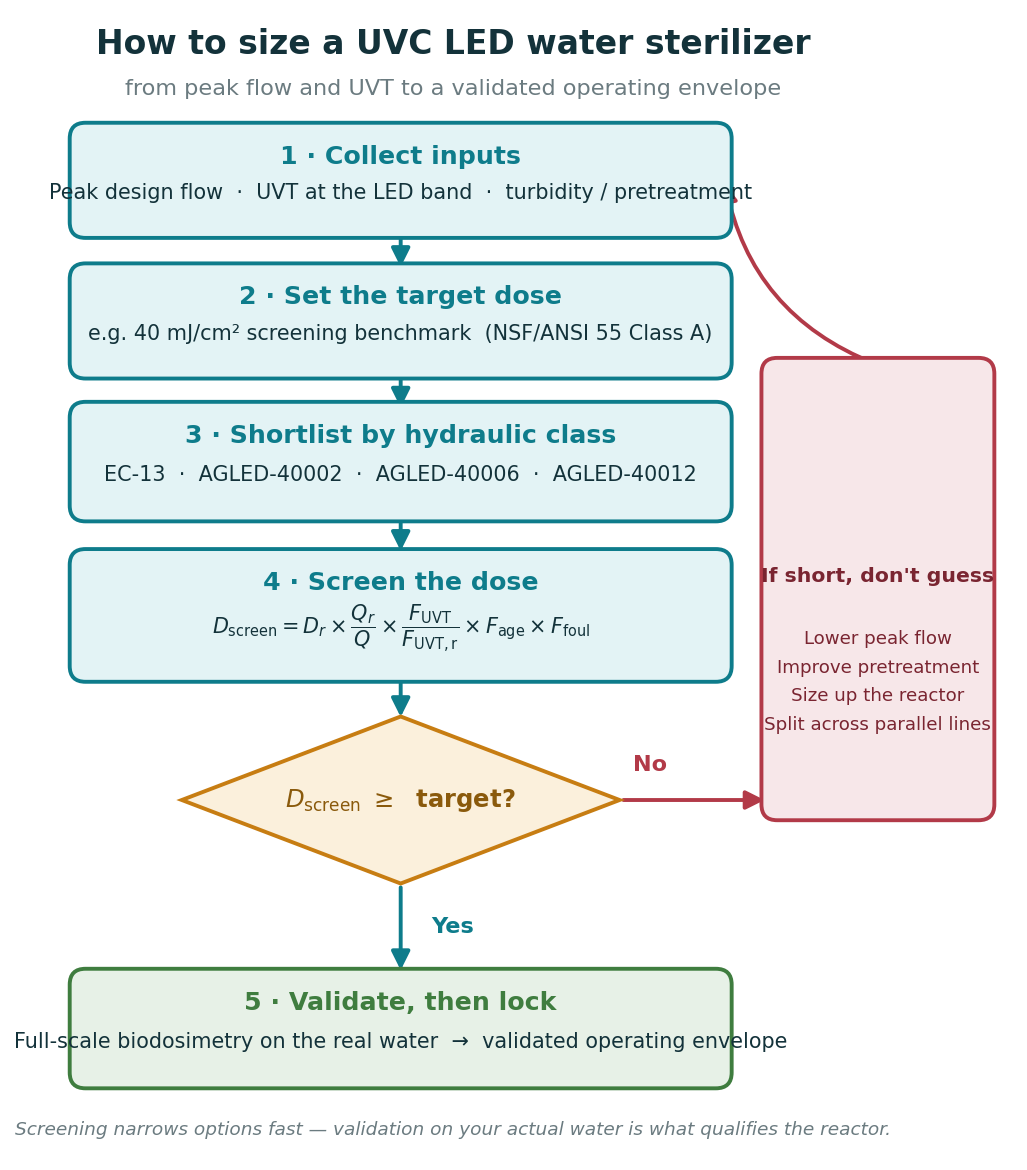
UV, however, demands stronger proof of delivered performance. EPA states that UV leaves no residual that operators can monitor to confirm delivered dose, so validated operation must track flow rate, UV intensity, lamp status, and, where applicable, UV absorbance. EPA also requires validation to account for UV absorbance, lamp fouling and aging, sensor uncertainty, hydraulic effects, component failure, and inlet/outlet configuration. For residential or light-commercial systems, NSF/ANSI 55 adds another practical screen: Class A systems at 40 mJ/cm² target contaminated water and address bacteria, viruses, Cryptosporidium, and Giardia, while Class B systems at 16 mJ/cm² provide supplemental bactericidal treatment on already acceptable water. In other words, UV looks simple at the tap, but the engineering behind good UV is not casual (EPA, 2006; NSF/ANSI, 2024).
| Representative benchmark | Value | Why it matters |
|---|---|---|
| UV dose for 4-log Cryptosporidium credit | 22 mJ/cm² | UV is highly effective on chlorine-tolerant protozoa |
| UV dose for 4-log Giardia credit | 22 mJ/cm² | UV reaches protozoan targets at comparatively low dose |
| UV dose for 4-log virus credit | 186 mJ/cm² | Viruses need much more UV dose than protozoa |
| Free chlorine CT for 4-log virus inactivation at 10 °C, pH 6–9 | 6 min·mg/L | Chlorine is efficient against viruses |
| Free chlorine CT for 3-log Giardia at 10 °C, pH 7.0, 1.0 mg/L residual | 112 min·mg/L | Giardia control by chlorine is much harder than virus control |
| WHO operational free chlorine target | ≥0.5 mg/L after 30 min at pH <8.0; 0.2 mg/L at delivery | Residual protection drives chlorine use in distribution |
| U.S. chlorine MRDL | 4.0 mg/L as Cl₂ | Residuals must stay inside a regulatory ceiling |
Table basis: EPA LT2ESWTR UV dose table, EPA CT tables, WHO chlorine residual guidance, and U.S. EPA drinking-water regulations.
Which method performs better in real drinking-water conditions
For surface-water or high-risk source-water treatment, UV usually wins the protozoa argument outright. EPA’s microbial treatment framework for public water systems still centers on 3-log Giardia and 4-log virus control, with additional Cryptosporidium treatment under the enhanced surface-water rules. Because Cryptosporidium resists common chlorination practices, designers often use UV where protozoan assurance drives the design. That is not a trend claim. It is the direct logic embedded in EPA’s treatment framework and health advisory language.
For virus and bacteria control in clear water, chlorine remains very strong, especially when it can maintain residual in downstream piping. EPA’s CT table for 4-log virus inactivation by free chlorine ranges from 12 min·mg/L at 0.5 °C to 2 min·mg/L at 25 °C at pH 6–9. That is an efficient barrier. Then, unlike UV, chlorine keeps working after treatment, which matters in tanks, low-use branches, hotel loops, healthcare buildings, and municipal distribution systems where microbial regrowth can occur after the treatment skid. WHO’s residual guidance makes that operational advantage explicit.
For taste-sensitive, appliance-integrated, or low-chemical applications, UV gains ground quickly. WHO reports that many people can taste chlorine or chloramines below 5 mg/L and some at around 0.3 mg/L, so even compliant residuals can trigger consumer complaints. UV avoids that sensory penalty at the treatment point. It also avoids chlorine handling, residual monitoring, and chlorine-demand uncertainty at the skid itself. Therefore, UV often fits better in under-sink, dispenser, RV, coffee, and food-service water designs that prioritize final-point hygiene and low operator burden.
For UVC LED systems specifically, technical buyers should stop asking only whether “LED equals UV.” The smarter question is whether the chosen wavelength, reactor geometry, and target organism align. Beck et al. reported that multiple UV sources produced similar E. coli inactivation, but the 260 nm LED performed best for MS2, while the medium-pressure lamp performed best for HAdV2 and Bacillus pumilus. That finding matters because it proves that microbial target and wavelength pairing can influence system selection, especially in compact LED reactors (Beck et al., 2017).
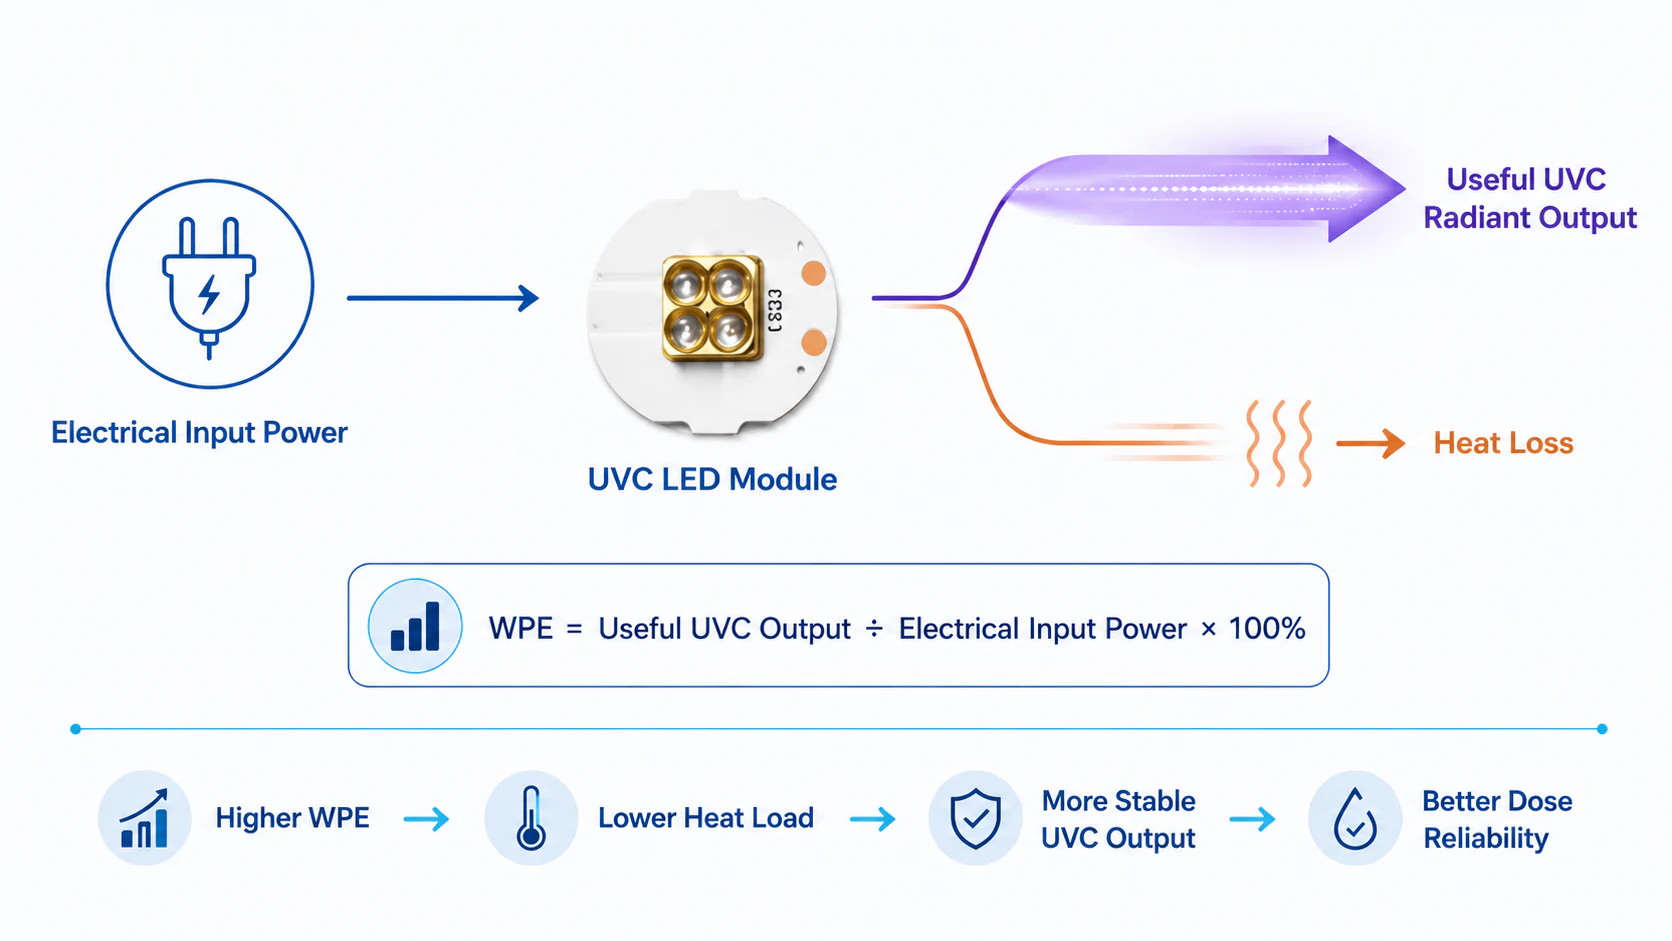
Applied research now backs real deployment as well. In a field study at small and decentralized water facilities, Oguma and coauthors reported 2.7-log E. coli inactivation at 30 L/min in a community-based water supply using a UV-LED module (Oguma et al., 2023). Meanwhile, recent UV-LED reviews report that application space has widened as optical power rises and price per watt falls, although wall-plug efficiency still improves more slowly than many OEMs would like (Rauch et al., 2024). For an Agua Topone audience, that means UVC LED now belongs in serious POU and POE engineering conversations, but only when suppliers can document target organism performance, validated flow range, UVT assumptions, and thermal management.
The strongest engineering answer often combines both methods. Because UV leaves no residual, any design that pushes water into storage or long distribution still needs a secondary disinfectant strategy. In fact, research on post-UV recovery shows why hybrid trains matter: Quek and coauthors found that photoreactivation can occur after medium-pressure UV treatment, while 1 mg/L monochloramine prevented photoreactivation for the duration of their experiment. So, when buyers ask whether UV replaces chlorine everywhere, the honest answer is no. UV often replaces chlorine as the primary barrier, but not as the secondary residual in systems that need downstream protection.
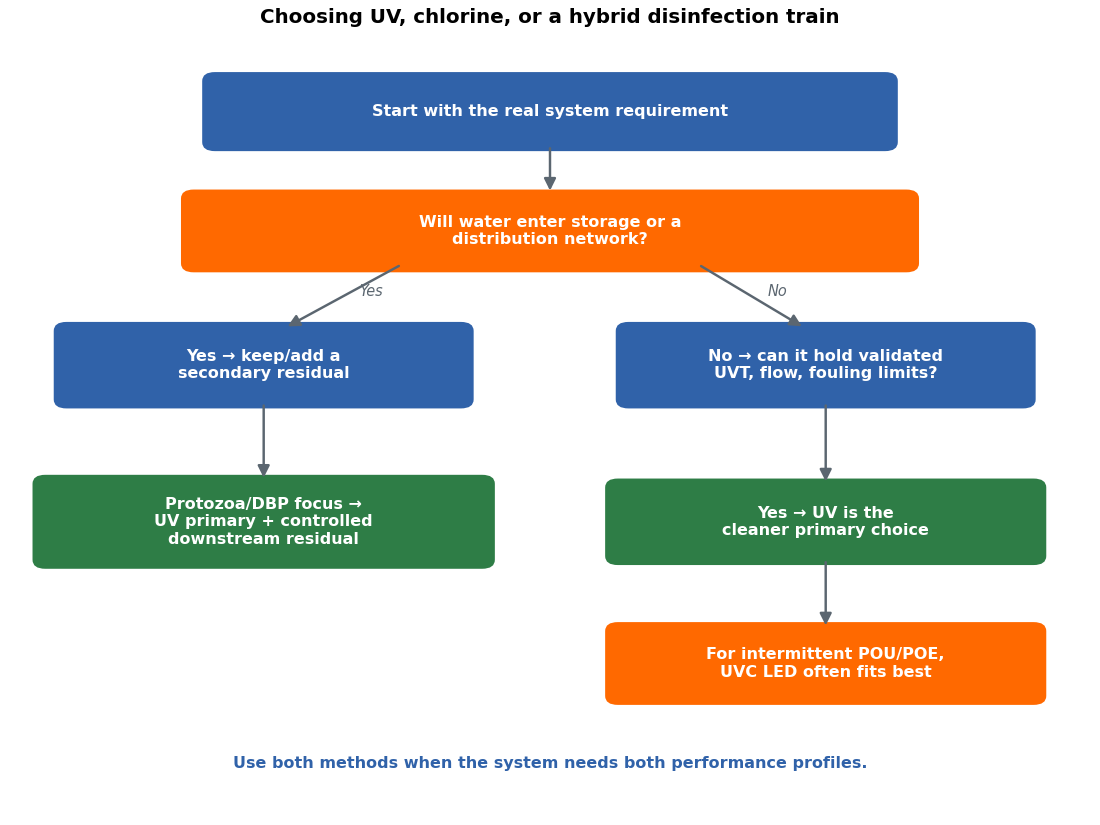
The decision logic below translates the evidence into a spec-level selection path. It synthesizes EPA, WHO, NSF, and peer-reviewed UV-LED findings.
System-selection logic (UV vs. chlorine vs. hybrid):
- Will the water enter storage or a distribution network?
– Yes -> keep or add a secondary disinfectant residual.- If protozoa control or DBP reduction drives the design -> use UV as the primary barrier, then maintain a controlled downstream residual.
- Otherwise -> chlorination can serve as the primary barrier when CT, pH, demand, and DBPs stay controlled.
- No -> can the water hold validated UVT, flow, and fouling limits?
- Yes -> UV is usually the cleaner primary choice; for intermittent POU/POE duty, UVC LED often fits especially well.
- No -> add pretreatment or reconsider a chemical-first strategy.
What buyers and engineers should specify before choosing a system
Start with the microbial target. If your risk profile centers on Cryptosporidium or Giardia, UV deserves first consideration because EPA’s credited UV doses for those protozoa sit far below the virus doses and because Cryptosporidium resists ordinary chlorination. If your greater concern is downstream regrowth in a tank or network, chlorine or chloramine residual becomes non-negotiable. Good designs begin by naming that priority explicitly.
Then define the operating envelope, not just the peak flow on the brochure. EPA’s UV guidance requires validated operating conditions around flow, intensity, lamp status, absorbance, fouling, aging, hydraulics, and component failure. For residential and light-commercial equipment, require NSF/ANSI 55 Class A when you need a true microbiological barrier rather than supplemental polishing. For chlorination, require pH, temperature, contact time, and demand assumptions that actually match site conditions, not laboratory optimism.
Next, define the residual strategy. WHO recommends maintaining free chlorine residual through distribution, with at least 0.2 mg/L at the point of delivery. Therefore, UV-only designs work best where water moves directly to use or where plumbing runs stay short and well controlled. Once you add storage, dead legs, or extended distribution, UV alone no longer answers the entire microbial-control question.
Also define the chemical-risk and acceptability boundary. EPA’s DBP limits for TTHMs and HAA5, EPA’s 4.0 mg/L MRDL for chlorine, and WHO’s taste observations show that compliant chlorination still needs careful optimization. If your source water carries natural organic matter, the designer must evaluate DBP formation potential early. If your application serves premium drinking water at the point of use, taste and odor complaints can damage customer acceptance long before the system violates a regulation.
For UVC LED procurement, ask three extra questions. First, which wavelength or wavelength combination was tested against which organism? Second, what flow rate and UVT range were validated? Third, how does the supplier manage thermal output, optical depreciation, and on/off duty cycles? Recent literature shows exactly why these questions matter: wavelength influences inactivation performance, UV-LED systems already work in decentralized water settings, and the technology continues to improve, but efficiency and validation still decide whether the design wins commercially or only in theory.
For technical buyers, the defensible conclusion is conditional: use UV as a non-chemical primary barrier when the reactor is validated for the intended organism, flow and water quality; use chlorination when residual protection through storage or distribution is required; use a combined treatment train when both duties apply. Review POU and POE options in that system context.
Frequently asked questions
Is UV better than chlorine for well water disinfection?
UV is usually the better primary barrier for clear well water when the goal is final-point microbial protection without chlorine taste or byproduct concerns. However, if the system includes storage or long plumbing runs, a downstream disinfectant residual may still be necessary.
Can UV replace chlorine in a building or municipal distribution system?
Not by itself in most distribution applications. UV provides strong primary disinfection, but it leaves no residual. Systems that store water or distribute it through long pipe networks usually still need a secondary disinfectant residual such as chlorine or chloramine.
What should engineers verify before selecting a UVC LED water disinfection system?
Verify target organism performance, validated flow range, UV transmittance assumptions, optical output over life, thermal management, and the relevant certification or validation basis. For residential applications, Class A UV certification and documented microbiological performance matter more than generic sterilization claims.
References
U.S. EPA (2006), Ultraviolet Disinfection Guidance Manual for the Final LT2ESWTR. Core source for UV dose credits, the fact that UV leaves no residual, and required validation/monitoring parameters.
U.S. EPA (2020), Disinfection Profiling and Benchmarking: Technical Guidance Manual. Core source for free-chlorine CT tables, including virus and Giardia values and units in min·mg/L.
U.S. EPA (current NPDWR pages), National Primary Drinking Water Regulations and Stage 1/Stage 2 DBPR pages. Core source for TTHM, HAA5, and chlorine MRDL values and for EPA’s DBP regulatory framing.
WHO (Guidelines for Drinking-water Quality, Annex 3). Core source for recommended operational free-chlorine residuals in distribution and the 5 mg/L guideline value for chlorine.
WHO (2003), Chlorine in Drinking-water. Core source for chlorine chemistry, hypochlorous acid/hypochlorite equilibrium, practical occurrence levels, taste observations, and hypochlorite storage concerns.
NSF and ANSI/NSF summaries of NSF/ANSI 55-2024. Practical source for residential/light-commercial UV certification language, especially Class A versus Class B design intent.
Hijnen, Beerendonk, and Medema (2006), Water Research. Foundational peer-reviewed review establishing that UV is effective across waterborne pathogens and quantifying fluence-response relationships from high-quality studies.
Beck et al. (2017), Water Research. Useful peer-reviewed evidence that wavelength and UV source type change organism-level performance; especially relevant for UVC LED specification.
Oguma et al. (2023), Journal of Water and Health. Field evidence that UV-LED disinfection can work in decentralized water settings, including the reported 2.7-log E. coli result at 30 L/min.
Rauch et al. (2024), Water Research X. Useful recent review showing UV-LED progress in optical power and price per watt, while wall-plug efficiency improves more slowly.
Quek et al. (2006), Water Research summary via EPA HERO/PubMed snippets. Supports the claim that post-UV photoreactivation can occur and that downstream chloramination can suppress it.